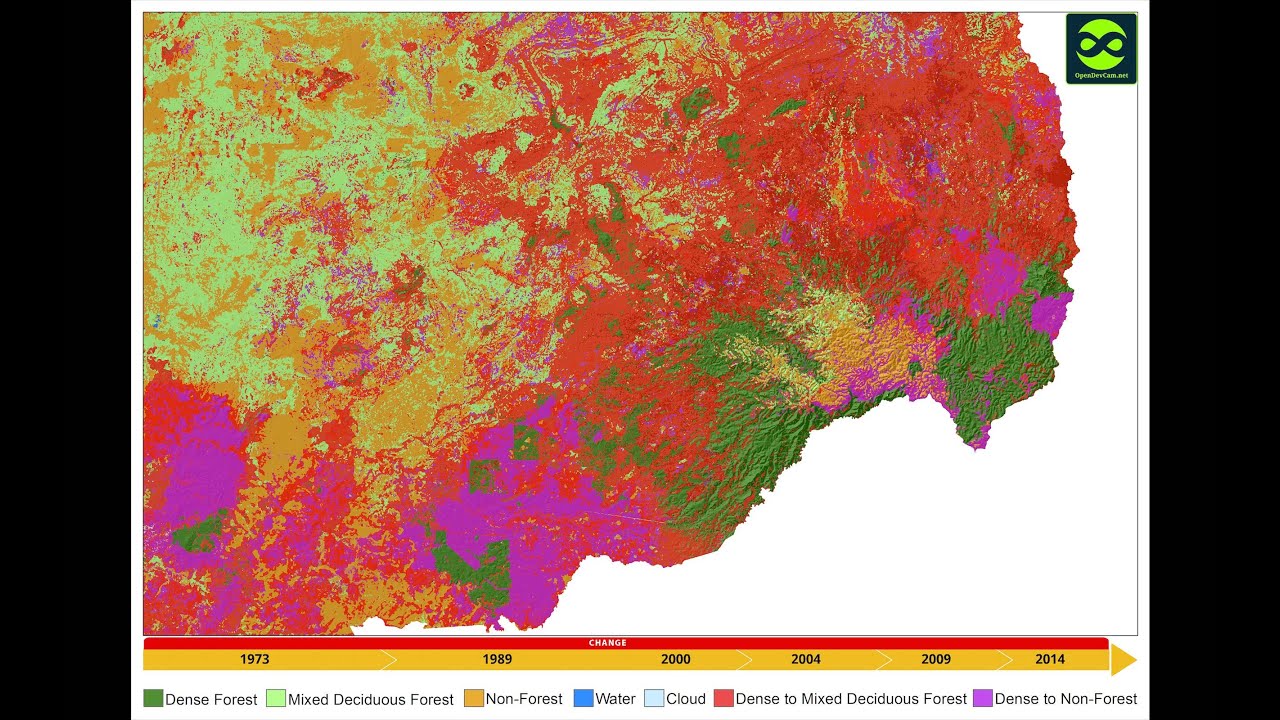
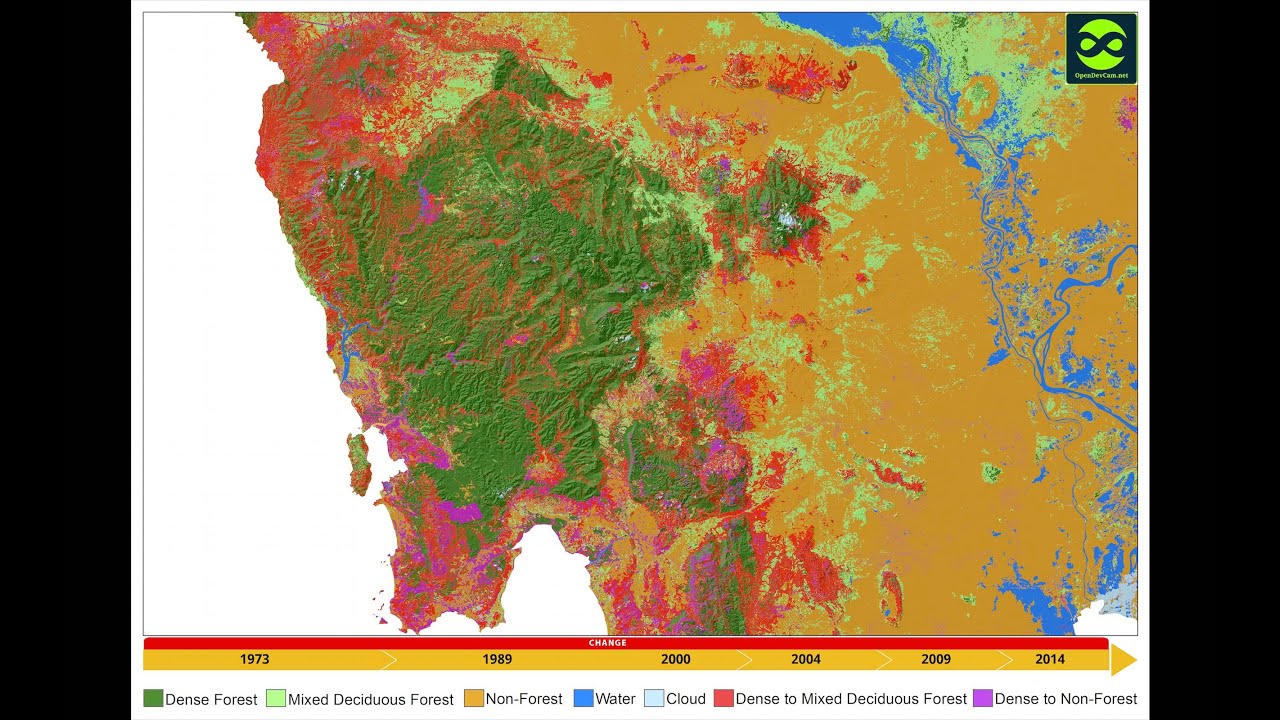
The animation shows Cambodia's forest cover change between 1973 and 2014 on a series of six maps. ODC mappers determined where dense forest was lost using image classification techniques -- the changes are shown using contrasting colors. Dark green represents dense forest. Red denotes areas of lost dense forest that were first detected on that year's map. As the animation progresses to the next frame, red areas disappear to reveal the new status of the land as either mixed forest or non forest. In the last frame of the animation, red is used to show the total amount of dense forest lost between 1973 and 2014.
For more information regarding these maps, including the scope and limitations of the project, please see: www.opendevcam.net/briefings/forest-cover/
Cambodia (1973 - 2014) open dataset | |
| 2 Likes | 2 Dislikes |
| 111 views views | 451 followers |
| Education | Upload TimePublished on 30 Mar 2015 |